Crypto Prices Haven’t Moved Yet, But Market Makers Are Already Frantically Canceling Orders: How a New Indicator Provides Early Warning of Severe Market Volatility?
Author: Glassnode InsightsCompiled by: TechFlowTechFlow Introduction: In traditional crypto derivatives and spot analysis, traders often rely on static order book depth and bid-ask spreads to assess liquidity. However, market makers' high-frequency cancelations and repricing behaviors mean that static snapshots often mask genuine liquidity crises and sharp price swings.The on-chain quantitative analysis giant Glassnode team has officially launched a new high-frequency indicator, "Book Churn." Through long-term backtesting of six years of microscopic order book data for Ethereum and Bitcoin perpetual contracts, the system quantifies the leading predictive value of market maker quote refresh speeds on the next hour's realized volatility.Why Traditional Order Book Indicators Have Natural Blind SpotsMost order book indicators merely describe a static snapshot at a fixed moment: i.e., how much capital is currently placed as limit orders near the top of the book on both sides, or what the cu

Author: Glassnode Insights
Compiled by: TechFlow
TechFlow Introduction: In traditional crypto derivatives and spot analysis, traders often rely on static order book depth and bid-ask spreads to assess liquidity. However, market makers' high-frequency cancelations and repricing behaviors mean that static snapshots often mask genuine liquidity crises and sharp price swings.
The on-chain quantitative analysis giant Glassnode team has officially launched a new high-frequency indicator, "Book Churn." Through long-term backtesting of six years of microscopic order book data for Ethereum and Bitcoin perpetual contracts, the system quantifies the leading predictive value of market maker quote refresh speeds on the next hour's realized volatility.
Why Traditional Order Book Indicators Have Natural Blind Spots
Most order book indicators merely describe a static snapshot at a fixed moment: i.e., how much capital is currently placed as limit orders near the top of the book on both sides, or what the current bid-ask spread looks like.
Static depth only tells us how much capital is currently resting in the order book, but fails to measure how frequently market makers cancel and resubmit orders behind the scenes to maintain this surface-level depth.
This is precisely the core motivation behind Glassnode's launch of the new "Book Churn" indicator: it quantifies the total number of times limit orders across various price levels in the order book are updated and rewritten within a specific time window.
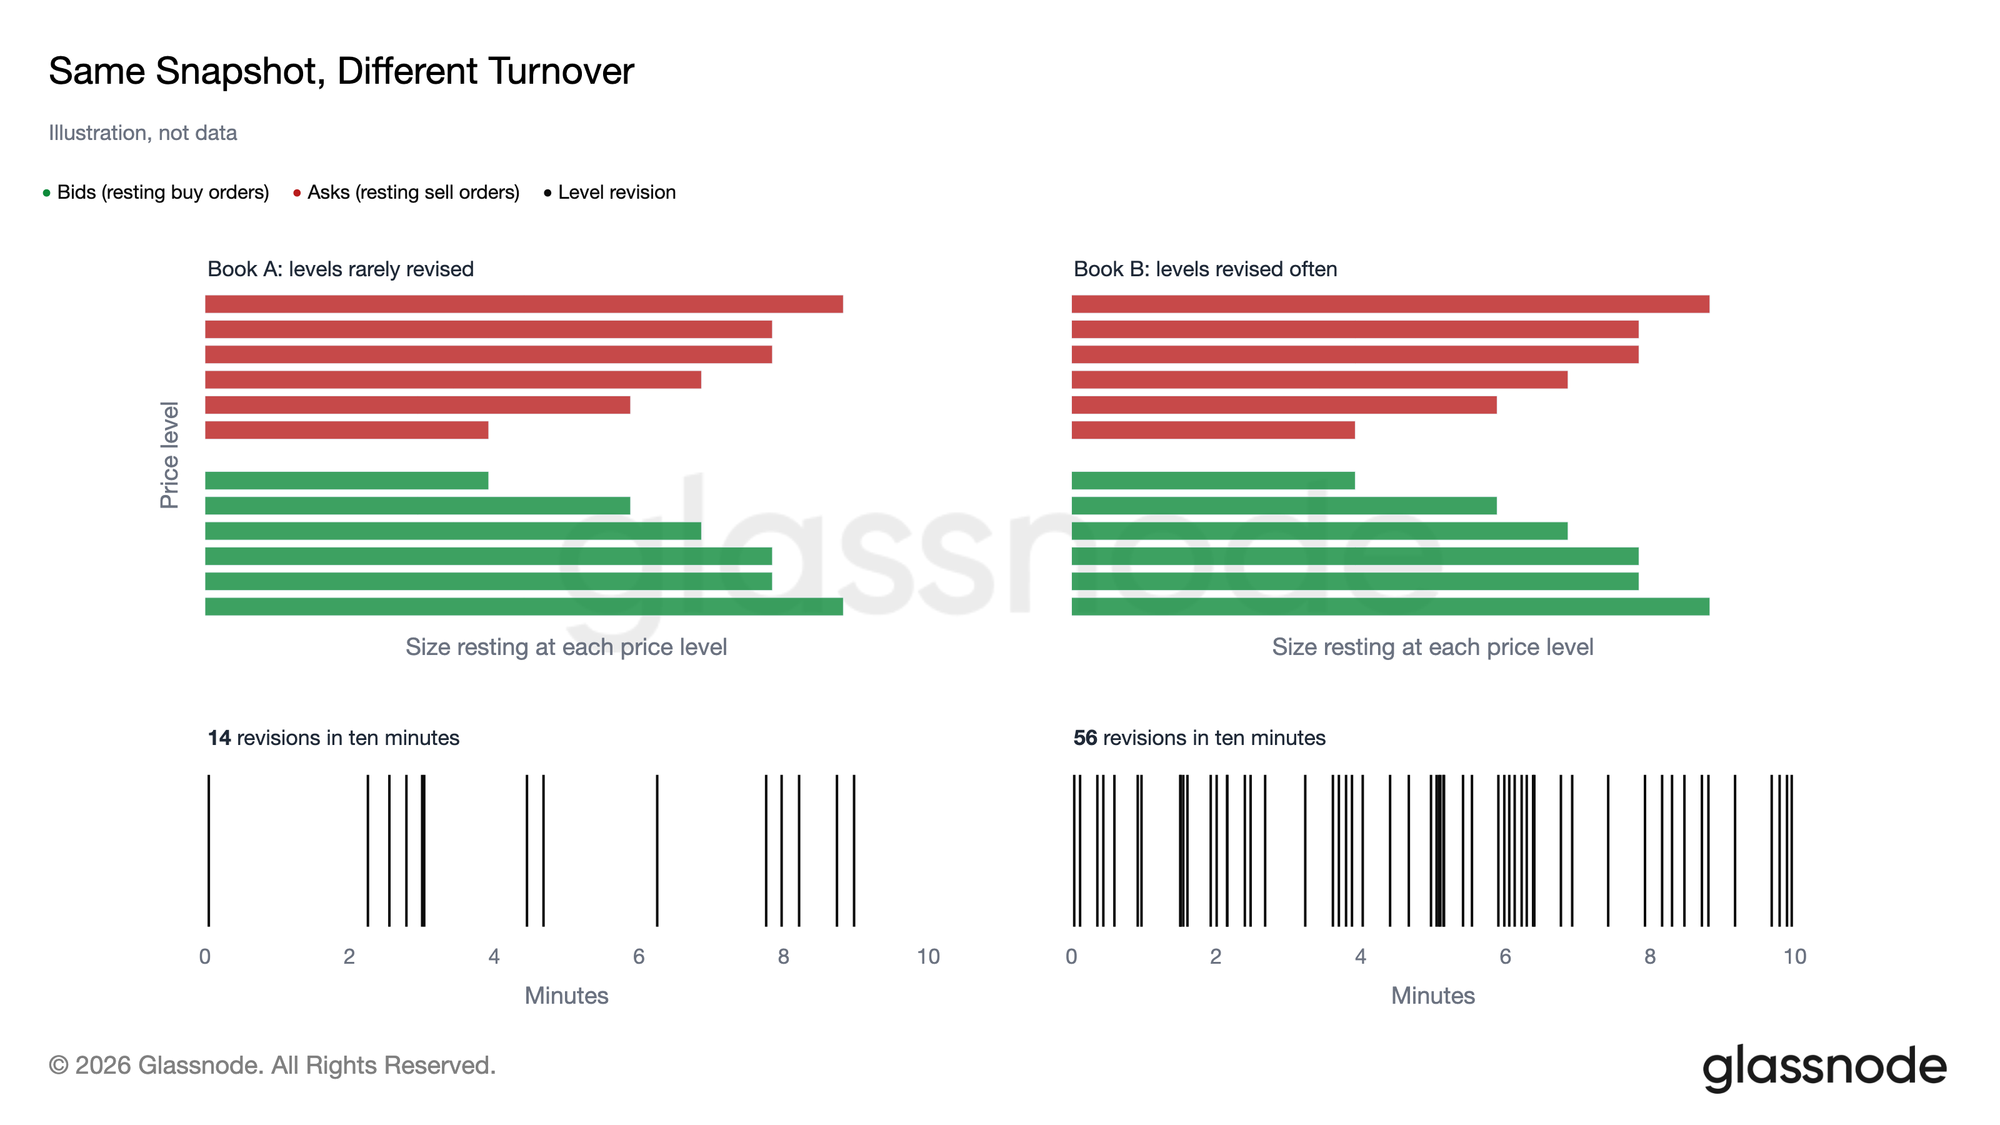
Figure: Two order books with identical static depth and spreads can exhibit differences in churn rates by several times or even tenfold.
As shown in the example above, two order books with identical cross-sectional buy/sell depth and spreads can have vastly different activity levels at the micro level. Snapshots cannot distinguish between them, but churn counting cuts through the noise instantly.
What the Indicator Actually Measures: Seeing Through Market Makers' True Sentiment
When market makers feel comfortable with current market conditions, they tend to let their quotes rest quietly; when they sense potential risk and grow nervous, they rapidly cancel orders, recalculate, and resubmit at new prices with startling frequency.
We capture this microscopic, microsecond-scale activity. Within each 10-minute time window, we precisely count the row changes corresponding to all depth updates.
The raw data volume is massive: on the Bitcoin perpetual contract market, a typical 10-minute window usually contains approximately 607,000 level changes, spiking into the millions during periods of extreme volatility.
To ensure comparability across different market cycles, we apply a logarithmic transformation to the raw churn counts and calculate standardized Z-Scores by combining them with the asset's historical mean and standard deviation over the past 60 days.
What Signals Are Actually Missed by Static Depth and Spreads?
Within order book microstructure, the fluctuation amplitude of static depth is far smaller than the drastic changes in churn counts. During normal trading conditions, even if the total quoted amount changes slightly, the liquidity friction from background cancelations and submissions may have already surged.
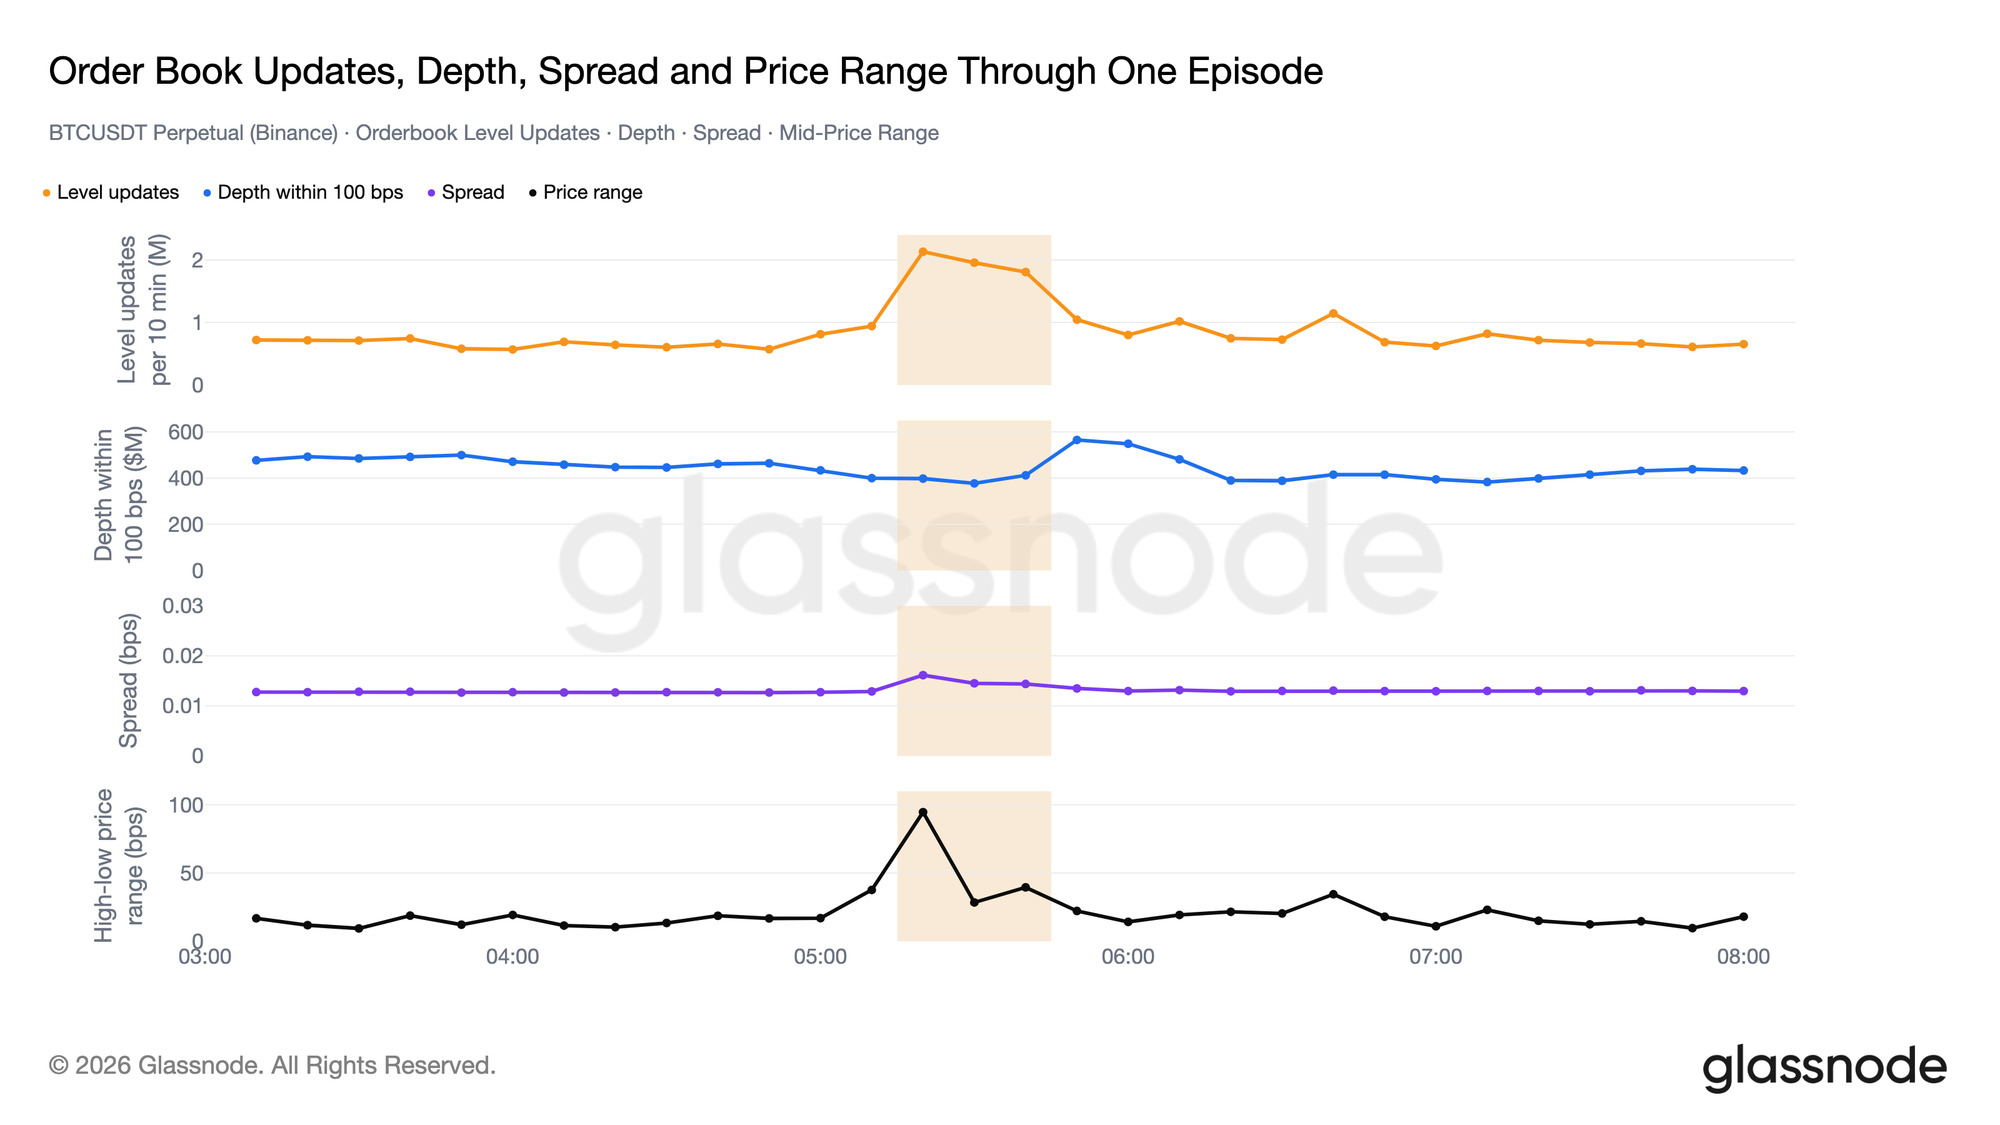
Figure: In real market conditions, static depth and spreads remain calm while the order book churn rate experiences an explosive surge in advance.
The figure above showcases a real-world backtest case from April 2026: before prices experienced a sharp directional breakout, both static depth and weighted spreads remained within normal means, yet churn counts had already spiked abnormally ahead of time.
This indicates that internal models are already sensing potential liquidation cascades or external macro shocks, rapidly withdrawing passive liquidity, and high-frequency probing defensive levels algorithmically.
The Construction Mechanism of Standardized Scores (Z-Score)
To eliminate systematic bias caused by shifts in overall trading volume magnitude across bull and bear markets, Book Churn utilizes a dynamically rolling standardized logarithmic distribution framework.
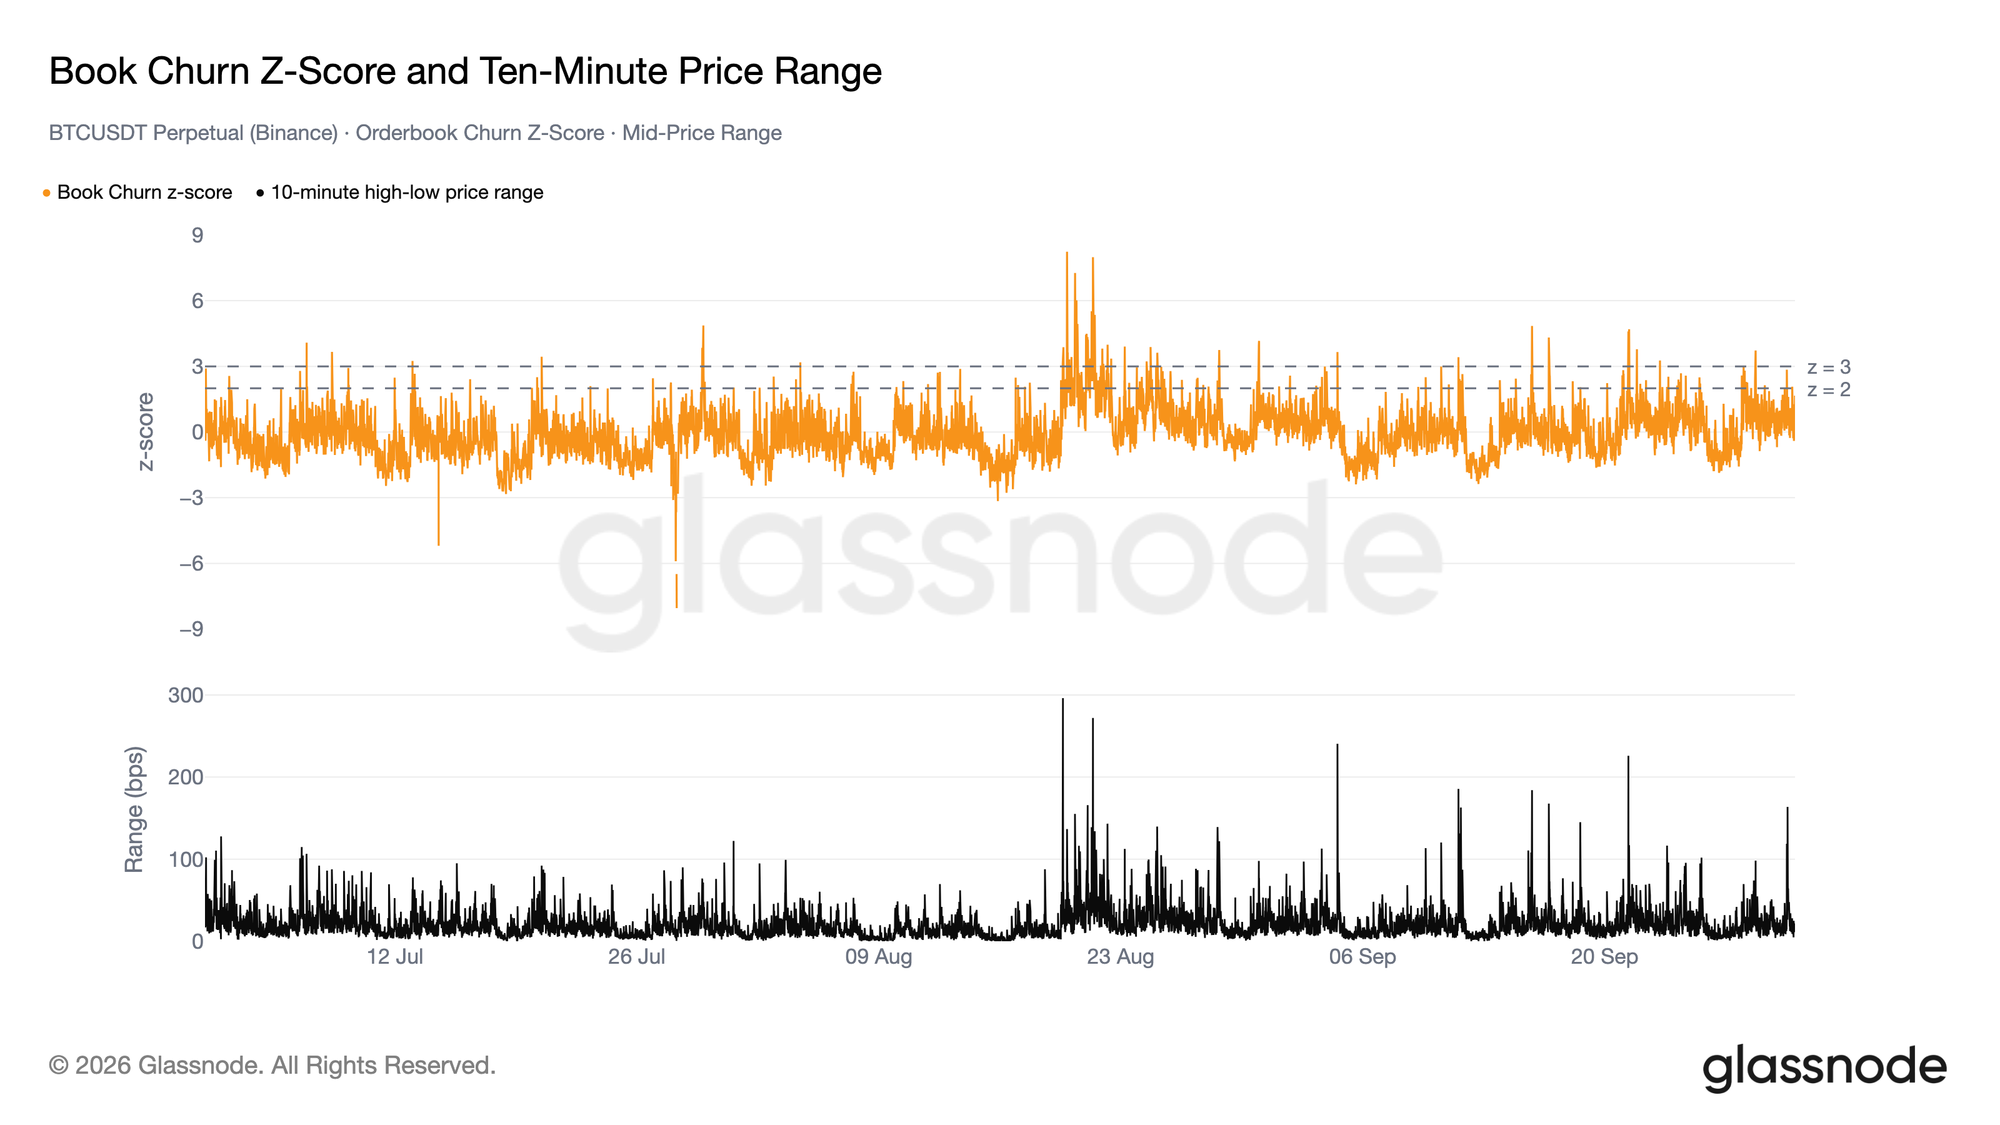
Figure: Correlation between the recent three-month trend of Bitcoin contract churn score movements and various extreme volatility intervals.
The baseline window for each trading pair is anchored to 10-minute slices over the past 60 days. This design ensures the indicator captures local sudden anomalies without becoming invalid due to broader bull/bear regime switches across months.
When the Z-Score exceeds 2, it means the current churn frequency has surpassed over 95% of the asset's recent historical norms; and when it breaks through 3, it signals entry into an extreme liquidity reconstruction state.
Frequency of High Anomalies and Event Identification
Based on our backtesting of all historical slices for BTCUSDT and ETHUSDT perpetual contracts on major exchanges since 2020, this score does not follow a traditional symmetric normal distribution, exhibiting a highly significant right-tailed effect.
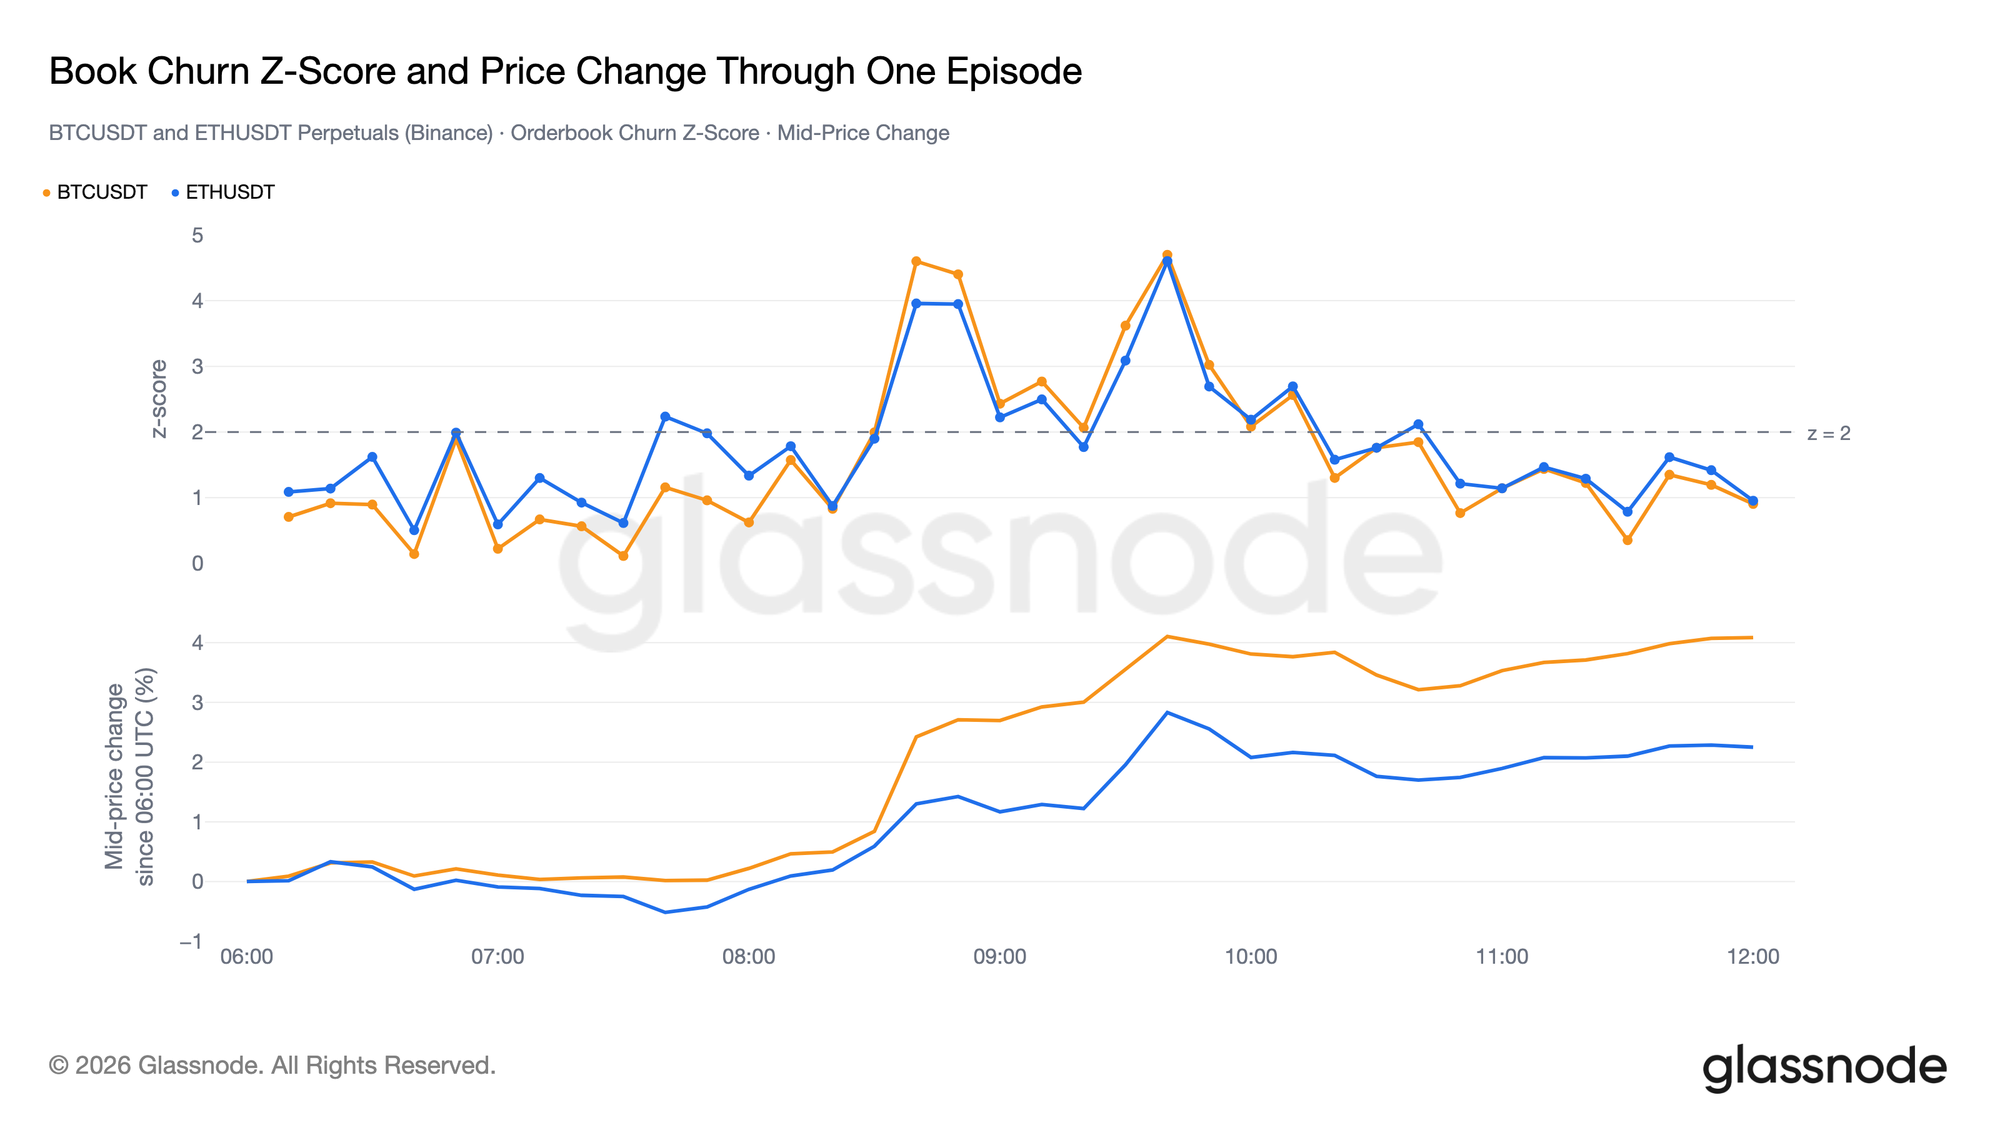
Figure: Cross-asset synchronized evolution of a typical high-frequency churn event between Bitcoin and Ethereum contracts.
For quantitative risk management and alerting strategies, the observation unit should be an "independent episode" rather than a single slice. A typical high-churn episode is usually composed of 2 to 5 consecutive high-score slices.
Cross-asset comparisons show highly overlapping churn peaks for Bitcoin and Ethereum during key macro shocks, reflecting market makers' coordinated risk contraction mechanisms across cross-asset arbitrage systems.
Volatility Warning Capability: Predictive Value for the Next Hour's Market Movement
The most critical practical question is: When order book churn suddenly spikes abnormally, does it signal larger price volatility erupting within the next hour?
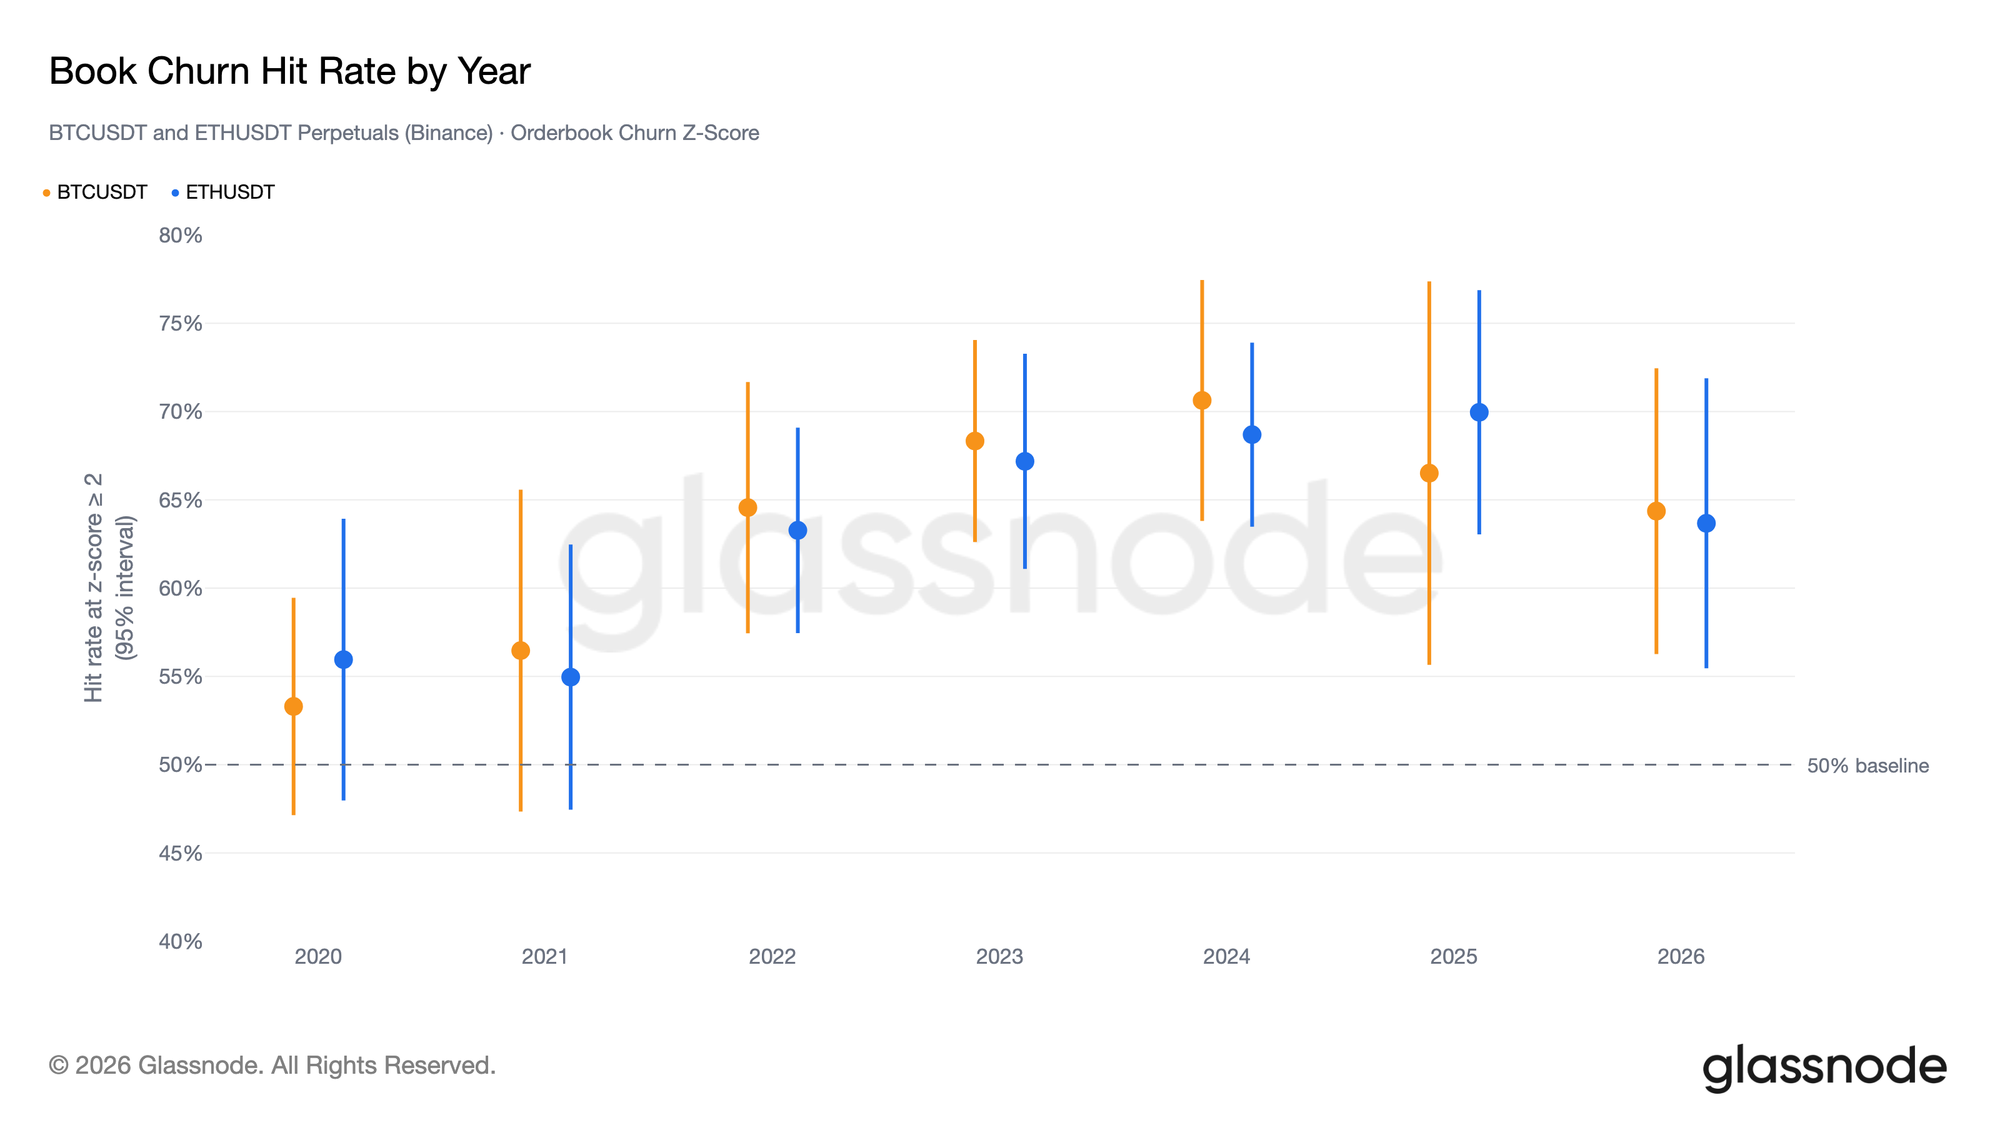
Figure: Long-term backtest performance of this indicator's predictive win rate for actual volatility in the next hour from 2020 to 2026.
Through a six-year backtest (covering bull and bear markets), we found that when the Book Churn score is greater than or equal to 2, the predictive win rate for the next hour's actual volatility exceeding historical baselines consistently remains between 65% and 72%.
This backtested win rate significantly surpasses the 50% random baseline under a 95% confidence interval, confirming that market maker high-frequency churn behavior is not merely a retrospective record, but an exceptionally valuable forward-looking warning signal in market microstructure.