
GitHub availability report: October 2026
In October, we experienced eight incidents that resulted in degraded performance across GitHub services. The post GitHub availability report: October 2026 appeared first on The GitHub Blog.


We continue to share monthly updates on the work behind GitHub’s availability and reliability.
The short version of October: we added substantial independently scalable Azure capacity and removed several ways that failures could escalate. However, write outages, monitoring gaps during data migrations, and a regional network disruption reinforced the need for capacity growth to be paired with safer operations, stronger isolation, and validated regional recovery.
As of November 9, 140 of 151 production services and 32 of 50 MySQL primaries were running in Azure Central US. Azure served 63% of migrated-service reads, 66% of monolith reads, and 52% of Git reads. We also completed a compute expansion across all nine Central US Kubernetes clusters, more than doubling capacity.
That capacity is already carrying real growth. Migrated-service traffic has increased 82% since March, with Central US absorbing the growth beyond the highest weekly-average load previously served from our existing datacenter. This gives GitHub more room to grow without pushing the original environment beyond its prior operating range.
We also made several targeted reliability improvements. Actions changes increased capacity for critical Azure control-plane requests. A separate NAT-gateway mitigation reduced usage by 85%; four production jobs failed during the change, compared with approximately 800 expected without the mitigation. Connection limits and other client improvements now also reduce the chance that a dependency interruption becomes a broader reconnect storm.
We removed concentrated sources of database load as well. A high-traffic GitHub Actions endpoint handling more than 250 million requests per day moved to a more efficient service path, reducing peak database reads by 85%. Requiring at least three characters before searching repository topics reduced slow or terminated queries for that pattern by approximately 98%.
Reliability was still not where it needed to be. The October 7 write outages exposed an unsafe interaction between database orchestration and production routing. An October 29 Azure network disruption affected all three Central US availability zones and at least 34,128 signed-in users. More details on these and other incidents follow.
The East US 3 buildout is about one week behind plan. The next phase starts with its first validated traffic ramp in the first week of December, while we continue hardening migration safety, dependency isolation, and regional recovery.
The principle remains the same: availability, then capacity, then features.
October 05 19:11 UTC (lasting 3 hours and 38 minutes)
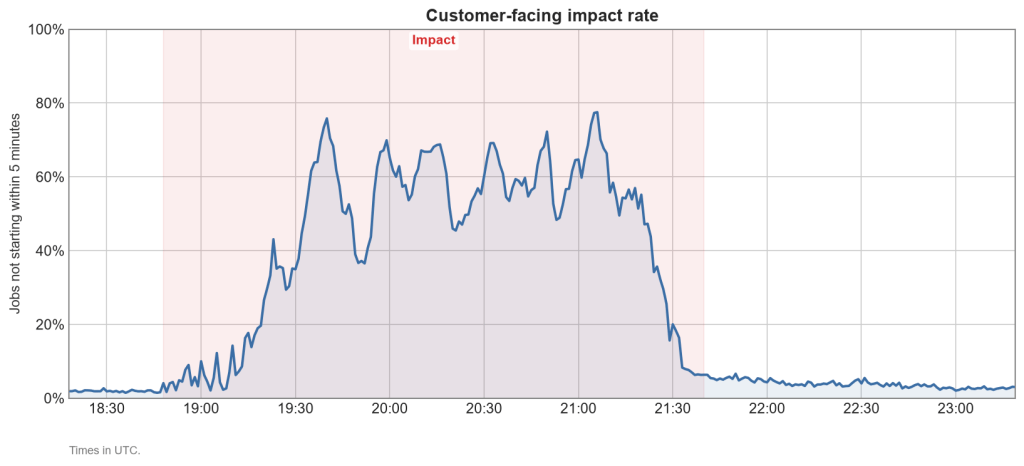
Duration: approximately 3 hours and 45 minutes.
Customers may have seen GitHub Actions jobs on GitHub-hosted runners stay queued much longer than usual, and some workflow runs failed to start. During the worst stretch, which lasted about 90 minutes, most jobs on GitHub-hosted runners did not start within five minutes. Impact eased as we failed over to healthy regions and added capacity. Self-hosted runners were not affected. GitHub Pages sites that build with actions were slow to update, though existing sites continued to serve normally. Some customers also saw errors in repository lists, licensing and billing pages, and some Copilot features.
What went wrong and why?
Actions jobs stayed queued or failed to start because the service that assigns jobs to GitHub-hosted runners stopped working reliably. A partial networking failure on our cloud provider’s side disrupted some of the connections between one of our datacenter regions and the cloud-hosted databases that service depends on. Instead of failing fast, the service waited for those calls to time out. The waiting calls piled up until the service ran out of memory and restarted.
Jobs then shifted to the same service in a healthy region, which did not have enough capacity for the extra demand and began failing too. At the same time, runners that went several minutes without receiving a job shut down and were slow to be replaced, so fewer runners were available to pick up jobs.
How did we respond?
- A partial networking failure began, and actions jobs started backing up.
- Alerts flagged errors and slow job assignment, and we declared an incident.
- We redeployed the service that assigns jobs to GitHub-hosted runners, but it did not recover. We traced the failures to the networking issue.
- We failed over the affected databases and storage to healthy regions, one service at a time, and added capacity. Actions recovered, but some other affected services kept failing even after failover.
- We worked with our cloud provider to resolve the networking failure. The remaining services recovered, and we resolved the incident.
How are we making incidents like this less likely or less impactful?
- We are making the service that assigns jobs to GitHub-hosted runners better able to handle sudden increases in load, so it keeps up when another region shifts extra jobs to it.
- We now have expanded prioritization of runner assignment based on customer profile when available runner capacity is degraded.
- We are changing the behavior of GitHub-hosted runners to reduce recovery time when job assignment services are degraded for a period of time.
- We are improving how quickly we detect and locate partial network failures between our datacenters and the cloud-hosted services they depend on.
October 06 19:57 UTC (lasting 3 hours and 43 minutes)
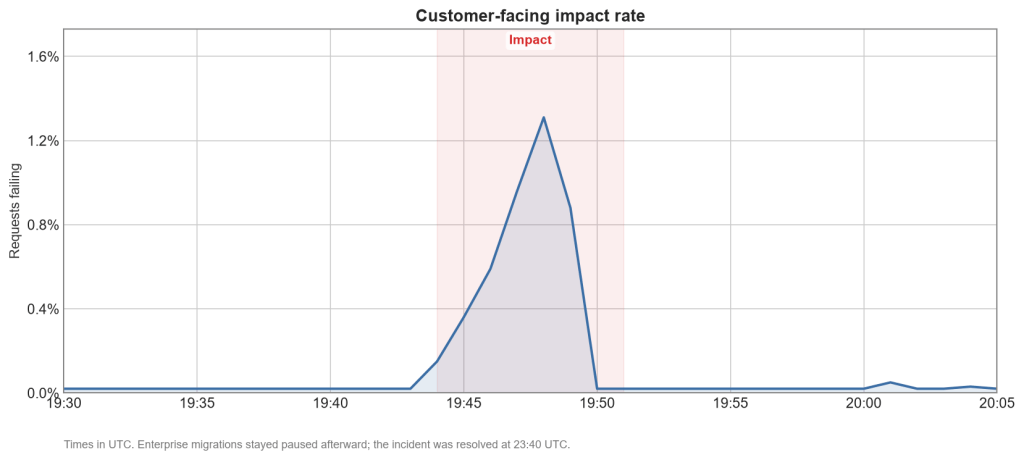
Duration: approximately 6 minutes of failed or slow requests across github.com, followed by approximately 3 hours and 30 minutes during which enterprise migrations were paused.
Customers may have seen server errors or slow responses when signing in, working with repositories and pull requests, calling the API, or using GitHub Codespaces. Retrying a short time later would have succeeded, and delayed webhook deliveries caught up soon after. At the peak, about 1.3% of all requests failed or timed out, and about 6.4K organizations saw at least one failed or slow request.
Migrations were paused for customers using GitHub Enterprise Importer, and were resumed once a fix was deployed.
What went wrong and why?
A surge in migration activity caused GitHub Enterprise Importer to send a burst of very large queries to a shared database. These queries took much longer than usual and, together with normal traffic, used all of the database’s available connections, preventing other github.com features relying on the same database from completing their requests.
The importer did not reduce its load when the database became overloaded. The impact ended within minutes, once the importer finished its queued queries and the database’s connections were released.
To prevent a recurrence, we paused migrations until we deployed a mitigation that runs these queries in smaller batches.
How did we respond?
- A surge of migration work overloaded a shared database, causing requests across github.com to fail or slow down.
- Automated monitoring detected the failures and paged our on-call engineers.
- The errors stopped on their own within minutes.
- We declared an incident and paused enterprise migrations to prevent a recurrence while we investigated the cause.
- Once a mitigation was deployed, we resumed migrations and resolved the incident.
How are we making incidents like this less likely or less impactful?
- We optimized the query GitHub Enterprise Importer sends to the database so that each one stays small and fixed in size.
- We are automating importer backoff when the database is under strain, easing load before it can affect other GitHub services.
- We are adding database alerts that flag queries doing much more work than usual and identify which query is responsible, so we can find and fix problems like this one faster.
October 07 15:14 and 17:17 UTC (lasting 1 hour and 11 minutes, and 47 minutes, respectively)
Duration: two separate write outages lasted approximately 10 minutes and 9 minutes, totaling about 19 minutes. The second was a recurrence of the first, with the same cause.
Customers may have seen errors when pushing code, signing in, updating pull requests or issues, or making changes through the API. Webhooks, GitHub Apps and OAuth, actions, code scanning, codespaces, and Copilot were also affected. Viewing content was largely unaffected. Data that was already saved was not lost, and actions that failed during the outages succeeded when retried after recovery.
Web and API request failures peaked at 8.9% in the first outage and 9.3% in the second, affecting more than 12,000 and more than 11,000 organizations, respectively. Some organizations may have been affected by both outages.
What went wrong and why?
During regular maintenance, we replaced machines that manage where database writes are sent. One new machine started with outdated records that still listed retired database servers. Once it was automatically elected leader, it published routing settings that sent writes for several core databases to those retired servers. Incorrect settings passed our existing validation and took effect immediately. Later, an automated maintenance task did not honor a pause on maintenance and triggered another election, and because the new machine had not yet been removed, it became leader again.
How did we respond?
- Automated monitoring alerted us to failing writes, and we declared an incident.
- Writes recovered when an established machine with correct records became leader and published correct settings.
- We traced the cause to the new machine, resolved the first incident, and paused automated maintenance to prevent a repeat.
- When a maintenance task did not honor the pause and the outage repeated, we declared a second incident.
- Writes recovered when an established machine became leader again. We removed the new machine and resolved the second incident.
How are we making incidents like this less likely or less impactful?
- We improved how we retire database servers, so outdated records aren’t left behind.
- We tightened controls on adding new machines that manage database routing, and making sure automated maintenance honors a pause.
- We strengthened validation of database routing settings, so incorrect settings are caught before they take effect.
October 19 15:49 UTC (lasting 1 hour and 7 minutes)
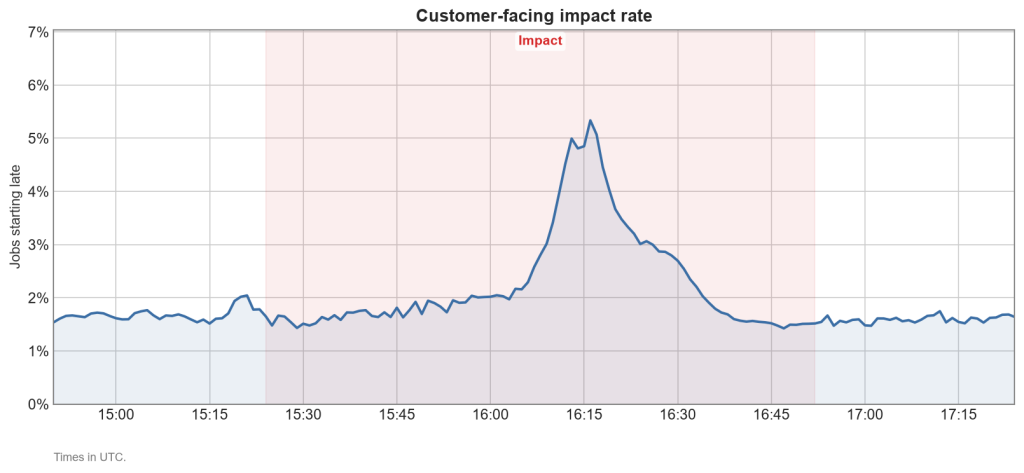
Duration: approximately 1 hour and 28 minutes.
Customers may have seen delays in GitHub Actions workflow status updates, logs, and checks. About 5% of jobs on GitHub-hosted runners experienced delayed starts, a very small share of workflow runs failed, and some requests to the actions jobs REST API returned errors. GitHub Pages deployments and workflow and check webhook events generated by actions runs were also delayed. For part of this time, live updates on github.com and code search were degraded.
What went wrong and why?
An internal actions service that stores workflow logs and run status lost connections to some of its cache servers in one cloud region. Every server running that service then retried those connections at the same time. Together, those retries saturated the network connections between GitHub’s data center and that region, disrupting other services that use the same link.
How did we respond?
- Automated alerts detected the failures, we declared an incident, and we traced the problem to the shared network link.
- We routed the actions service away from some of its cache servers in that region, but the link was still over capacity.
- We routed it away from the rest of those cache servers, and the link recovered.
- We raised processing limits to clear the actions backlog, and we resolved the incident once all affected services had recovered.
How are we making incidents like this less likely or less impactful?
- We have limited how quickly this actions service can open new connections to its cache servers.
- We are alerting on spikes in new connections from this service to identify and address the source sooner.
October 21 14:52 UTC (lasting 4 hours and 30 minutes)
Duration: approximately 6 hours and 46 minutes.
Customers may have seen delays in pull request updates, GitHub Actions workflow status updates, and webhook deliveries. After a push, new commits were slow to appear on pull requests. Workflows triggered by the push started late. Status checks from actions workflows could look stuck on pull requests, which held up merges that require those checks to pass. These features recovered within about 2 to 3.5 hours.
Audit log events were affected the longest. Recent activity took longer to appear when customers searched their audit logs, with delays of up to 1 hour and 50 minutes. Audit log events were fully caught up after about 6 hours and 46 minutes.
Some webhook deliveries from this period may be missing from webhook delivery history, though the webhooks themselves were delivered.
What went wrong and why?
Some servers in our event streaming platform were close to their memory limits, and memory use on these servers grows with the number of client connections. When requests to these servers failed, new connections were opened immediately, which increased the number of connections and the memory they used. The increase in memory use slowed down and overloaded the servers.
We took the overloaded servers out of service, and their traffic moved to other servers. Those servers then became overloaded too, and the problem spread to more servers over the following hour. We began rebalancing overloaded partitions onto brokers that had available capacity and this mitigated the issue.
Audit logs took the longest to recover. The service that writes audit log events kept restarting on errors from the platform for more than two hours and fell further behind. Once stabilized, it could only write events at a limited rate, so the backlog took several more hours to clear.
How did we respond?
- We declared an incident and moved some traffic off an overloaded server, but more servers became overloaded soon after.
- We split the busiest traffic into more partitions and moved it to less-loaded servers. All affected features except audit logs gradually recovered.
- Once the audit log service stopped restarting, we raised the rate at which it could write events so the backlog would clear faster.
- We resolved the incident once audit log delays were back within the healthy range, and the remaining backlog cleared afterward.
How are we making incidents like this less likely or less impactful?
- We added randomized delays to reconnects after a failed request, so servers that are already slow don’t get hit with a burst of new connections.
- We are alerting earlier on server memory use, so we can move traffic before a server slows down.
- We are adding a second destination for webhook delivery data that we can switch to, so we can keep webhook deliveries moving if our event streaming platform slows down.
- We have improved our playbooks to move hot partitions for similar situations in the future
October 28 14:12 UTC (lasting 1 hour and 16 minutes)
Duration: approximately 1 hour and 32 minutes.
Customers may have seen errors when using several GPT-family models in Copilot. Requests using these models in Copilot Chat in IDEs and on github.com, the Copilot CLI, Copilot code review, and the Copilot coding agent returned errors or did not complete. About one in 10 requests to the affected models failed. Other models continued to work, and choosing another model avoided the errors. Auto model selection reduced the errors by sending some requests to an unaffected model.
Code scanning autofix and code quality, which are built on one specific model without an alternative model to switch to, were affected more heavily.
What went wrong and why?
Copilot reaches these models through an upstream model provider and uses a credential to authenticate with that provider. That credential became invalid, the provider began rejecting our requests as unauthenticated, and our service returned those rejections to clients as authentication errors. Copilot features that use these models send their requests through that provider, so they began failing at the same time.
How did we respond?
- A credential we use with an upstream model provider stopped working, and requests to the affected models began to fail.
- Alerts flagged rising errors on the affected models, and we declared an incident.
- We posted a public status update and recommended choosing another model in the meantime.
- We traced the errors to our own credential and created a replacement.
- We began deploying the new credential, and requests started to recover once the first environment was updated.
- We completed the deployment in the remaining environments, confirmed that requests to the affected models had recovered, and resolved the incident.
How are we making incidents like this less likely or less impactful?
- We improved how our service handles authentication failures from upstream model providers, so requests can be retried instead of failing.
- We are strengthening how we manage credentials for upstream model providers.
- We are adding alerts for authentication failures from upstream model providers, so we can identify and address this kind of problem faster.
October 30 14:31 UTC (lasting 31 minutes)
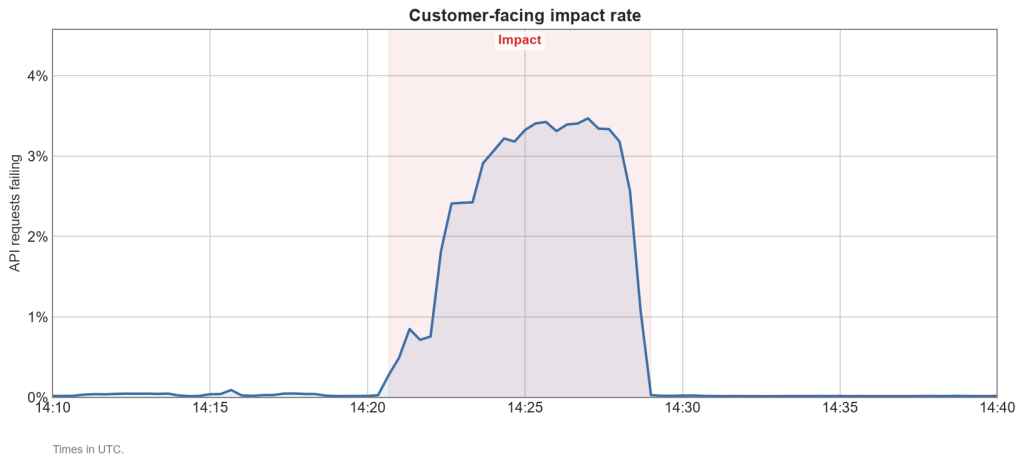
Duration: approximately 9 minutes.
Customers may have seen some requests to github.com hang for up to about 10 seconds and then fail with a server error. Pull request merges and Git operations over SSH and Git LFS were hit hardest. At the worst point, about 43% of merge attempts failed, compared with about 3.5% of API calls. Issues, GitHub Pages, notifications, and sign-in for GitHub Apps and OAuth apps also saw intermittent errors.
What went wrong and why?
A database connection pool used by many github.com services reached its limit, and for several minutes no connections were available. New requests that needed a connection waited until the connection timeout expired and then failed.
The pool was already running near capacity when some update requests started holding their connections far longer than expected. Each one began writing a change, then ran a separate lookup that could take several seconds, keeping its connection reserved but unused the whole time. With little headroom, those held connections helped tip the pool over.
How did we respond?
- Requests used up every connection in the shared database pool, and requests across github.com began to fail.
- We declared an incident after seeing failures, and on-call engineers for the affected services were paged.
- The pool drained and error rates returned to normal. Shortly after, we confirmed that the full connection pool had caused the errors and posted a public status update.
- We verified that database connections were back to normal and resolved the incident after monitoring for stability.
How are we making incidents like this less likely or less impactful?
- We are now running the slow lookup before these update requests start writing a change, so they no longer hold a database connection while they wait.
- We are evaluating limits on how long a pooled database connection can be held, so a slow request pattern is less likely to tie up the pool.
Follow our status page for real-time updates on status changes and post-incident recaps. To learn more about what we’re working on, check out the engineering section on the GitHub Blog.
The post GitHub availability report: October 2026 appeared first on The GitHub Blog.